Department of Electrical and Computer Engineering
University of Delaware, Newark, DE 19716
ABSTRACT
Information graphics, such as bar charts and line graphs, generally convey an intended message and thus are important in digital graphical contents. However, this visual representation of numerical data limits access to information for many people with visual impairment. We have developed a Multimodal Access to Information Graphics (MIGS) system to address the accessibility of information graphics. This approach is designed to detect information graphics from digital resources, to extract information from them, additionally, to conduct optimal visual-tactile conversion and provide text-based summarization based on preferences of the MIGS system users. This paper presents the general architecture of the integrated scheme and our solutions to several challenging problems in the system: identifying figures among the digital resources, segmenting text/ line-drawing layers within figures, and extracting comprehensive information.
KEYWORDS
Information graphic, multimodal access, image processing, image understanding
INTRODUCTION
Information graphics (such as line graphs, pie charts, etc.) become widely available with the growth of electronic documents and high bandwidth communications systems. They are common and pervasive in scientific documents, business reports, illustrating the key ideas and findings, enabling readers to understand the technical details of the work [1]. The cognitive mechanisms used to recognize these graphical patterns [2] depend on the human visual faculty, which sighted people can realize. Although people with visual impairment can independently access digital textual information with the help of text-to-speech and text-to-Braille software [3], unfortunately, without assistance from a sighted individual, access to the information contained in graphics is still impractical for people with visual impairment. To this purpose, we propose this system, providing effective multimodal access to the information graphics among the digital resources.
The whole effort contains two kinds of studies concerning access to graphical information: the first one is to determine optimal tactile graphic design methods and optimal text-base summarization approaches; the second one is to develop an information graphic processing system. In this paper, we first present the general scheme of the image processing system, and then we develop methods to address several challenging problems within the graphical content processing part, which include detecting and categorizing information graphics among the digital resources, segmenting text and line-drawing part within the figures and extracting information from them.
The paper is organized as follows. In Section II, we briefly review prior work on assisting techniques for image access. We present the general architecture of the MIGS system in Section III and then several methods dealing with challenging problems in the system are presented in Section IV. Finally, we conclude in Section in V, with a brief discussion on future work.
RELATED WORK
A survey of research in tactile graphic producing shows that conventional procedures rely on sighted tactile graphic specialist (TGS), which is time-consuming and labor intensive [4], and therefore, it does not support instant and independent access to graphics by visually-impaired users.
In recent years, efforts have been devoted to improving the conversion procedure and presenting information via latest computer technology, automatic systems which can detect and present information from graphical contents have attracted a lot of attention. Wang et al. [4] presented a system enabling seamless access to digital graphical contents for visually impaired individuals via semantic-aware processing. The system performs the image detection and categorization, graphic/image simplification and visual-tactile conversion. However, this system mainly considers the multi-level representation of continuous-tone-scale images, lacking the analysis of information graphics.
In [2], Ferres et al. proposed a framework of natural language model based graphical information understanding system called, iGraph, to exploit the clarity and ubiquity of natural language to help gain access to the information locked up in visual representations of data. The system consists of three main sub-systems: first, the P-System acquires information about a graph in some common markup language and translates it into a knowledge representation language that will permit inference. Second, the C-System, takes the representation from the P-System and reasoning with it by means of a set of rules. Finally, the L-System provides the human interface to the logical language of the C-System. However, the system supports only predefined simple, single line graphs and thus lacks comprehension.
PROBLEM STATEMENT AND SYSTEM OVERVIEW
Digital graphical contents range from line drawings to continuous-tone images, by continuous-tone images; we refer to pictures acquired by a camera or complex art work such as paintings [5]. Appropriate tactile cues from continuous-tone images can be extracted and presented through a multi-level simplification method [6]. Other than continuous-tone images, information graphics refer to a specific class of graphics, which are non-pictorial graphics that present complex numerical data and relations among them [6]. We aim at providing effective multimodal access to information graphics in digital documents by users with visual impairment without depending on the help of sighted professionals. For example, when a visually-impairment computer user is browsing the Internet or reading a document, the encountered information graphics can be automatically identified and processed, additionally, a tactile image is produced and a text-based summarization is presented to help the user gain comprehensive information from the figure. Such a system would be helpful to the people with visual impairment in their computer experience.
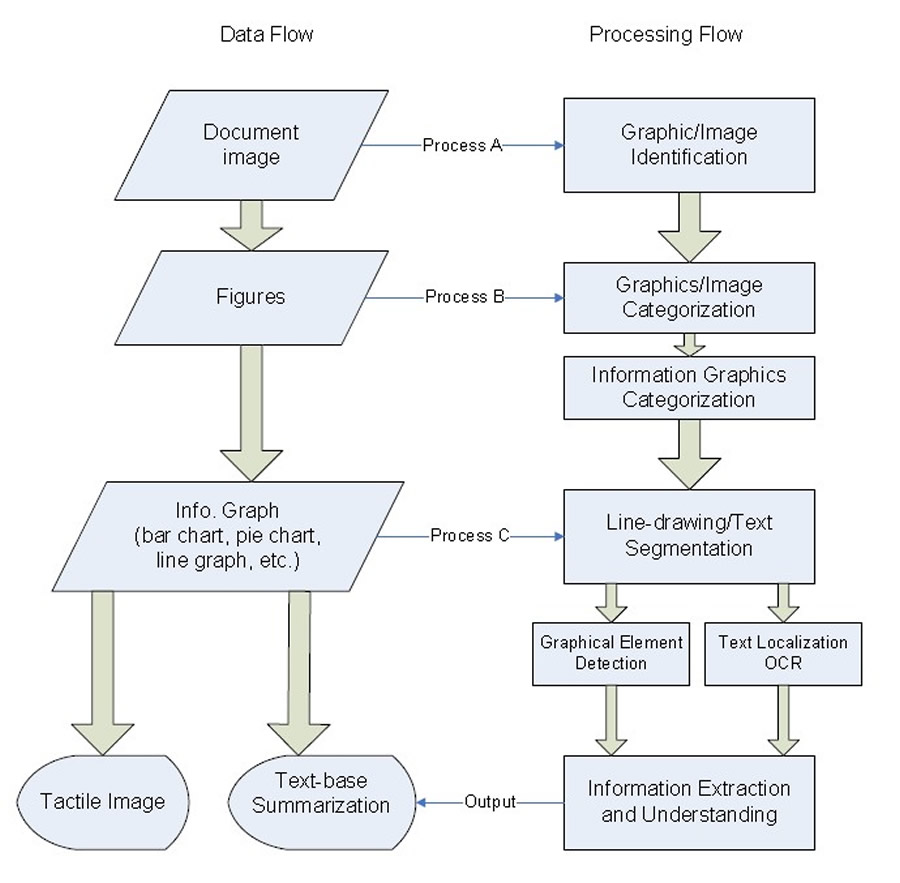 Graph 1: Overall design and data flow of the system
The conceptual model of the image processing system is depicted in Fig.1. Note that to realize the optimal multimodal access; we have to also determine optimal tactile graphic design methods and optimal text-base summarization approaches based on preferences of potential users of the system. The information extraction section of the system is then implemented based on the requirements of the summarization section.
THE METHODS
A. Graphic/Image Identification
It is often observed that in document images, figures such like drawings, charts, and photograph, are imbedded within large regions of text. In this step, the system automatically detects the presence of graphics within the screen. Scale invariant feature transform (SIFT) [7] [8] is applied to discriminate figure regions from the text regions. To learn a discrimination boundary between the text and image SIFT features, we evaluate several learning algorithms [9] and implement the optimal one in the system.
B. Automatic Categorization of Figures
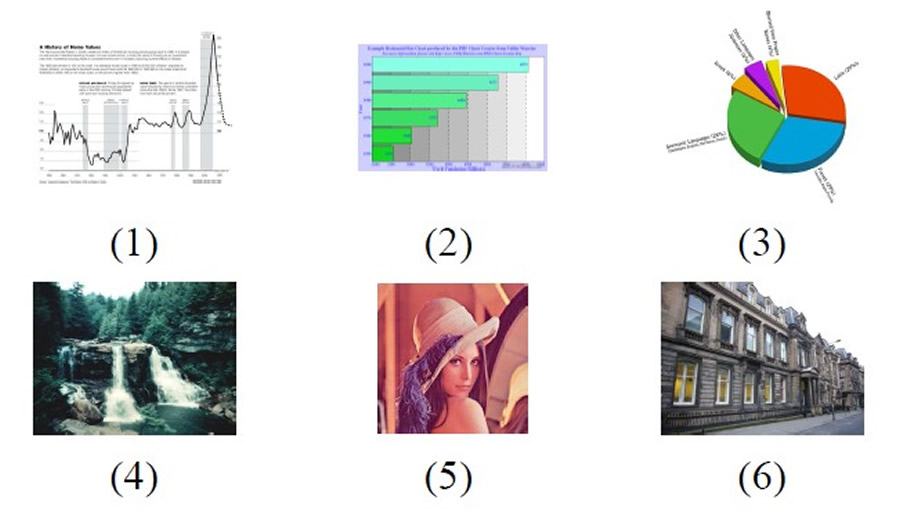 Graph 2: Several kinds of Figures
After the figure/text region segmentation, the text parts can be further processed by the OCR engine, producing Braille using Braille software [4]. The system classifies images into predefined classes using a hierarchical structure: first, we would like to use wavelet domain features [5] to classify the graphical contents into two classes: line-drawing graphics and continuous-tone images, after that, notice the fact that information graphics can be characterized by different objects contained in figures, such as lines (parallel, perpendicular, intersecting), curves, ovals, the line-drawing graphics are further categorized into bar chart, pie chart, line graphs, etc. based on the graphical elements. We conducted the graphic/photograph classification on a 50 images database including the figures in Graph 2 and the result is perfect with 100% accuracy using suitable parameters.
C. Model-based Information Extraction
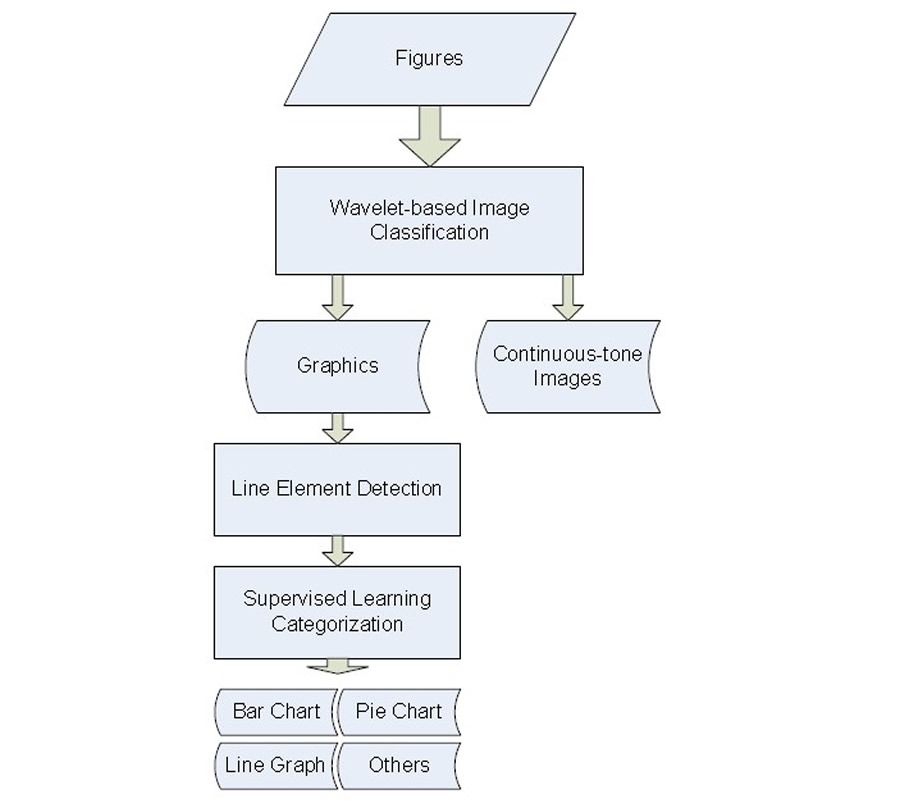 Graph 3: A description of the categorization section
This step extracts specific graphical and textual information [10] from the figures. Based on the class type from the previous step, we can extract data using the characters of each category. Note that textual labels always appear in graphics as descriptions. Thus we need to extract and localize both graphical and textual elements and process them in different layers. A combination of these two layers produces the output of the system. For the benefit of the reader, we present the bar element extraction result in Fig. 4.
CONCLUSION AND FUTURE WORK
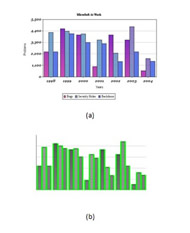 Graph 4: Bar elements (rectangle) extraction in a bar chart
 In this paper, a system based on the user preference is developed aiming at providing effective multi-modal access to the information graphics. A system overview is presented to show the main concerns of our work. Several methods to address the challenging problems are developed. This development is based on the latest research in the image processing, computer vision, statistical inference, as well as universal design and human computer interaction. Additionally, the multimodal information graphic system will be developed to work directly with existing tactile printers and Braille/synthesized speech output methods.
While this prototype has shown its potential, all the sections are subject to further improvement. In particular, we are extending the optimal tactile graphic design and text-base summarization based on user preferences. Also, an important future step is to improve the comprehension of graphic element extraction, such as dot lines and other symbols within the figures.
REFERENCES
- J.Z. Wang, X. Lu, P. Mitra and C.L.Giles, “Automatic categorization of figures in scientific documents,” in Proceedings, JCDL, Chapel Hill, NC., 2006.
- Shelley Roberts Leo Ferres, Avi Parush and Gitte Lindgaard, “Helping peole with visual impairments gain access to graphical information through nature language: The igraph system,” Computers Helping People with Special Needs, 2006.
- Terri Hedgpeth Teresa Haven Zheshen Wang, Baoxin Li, “Instant tactile-audio map: Enabling access to digital maps for people with visual impairment,” in Proceedings, International ACM Conference on Computers and Accessibility (ASSETS), 2009.
- X. Xu, Z. Wang and B. Li, “Enabling seamless access to digital graphical contents for visually impaired individuals via semantic aware processing,” EURASIP 2007
- Jia Li and Robert M.Grey, “Context-based multiscale classification of document images using wavelet coefficient distributions,” IEEE Trans. Image Processing, 2000.
- Sandra Carberry Seniz Denir and Stephanie Elzer, “Effectively realizing the infered message of an information graphic,” in Proceedings, IEEE Int. Conf. on User Modeling, Corfu, Greece, June 2007.
- D. Lowe, “Distinctive image features from scale-invariant keypoints,” IJCV, 2004.
- S. Baluja and M. Covell, “Finding images and line-drawings in document-scanning systems,” in Proceedings, Int. Conf. on Document Analysis and Recognition, 2009.
- J.T. Tou and R.C. Gonzales, Pattern Recognition Principles, Addison Wesley, 1974.
- J.B.Buckheit R.M.Gray K.O. Perlmutter, N.Chaddha and R.A.Olshen, “Text segmentation in mixed-mode images using classification trees and transform tree-structured vector quantization,” in Proceedings, ICCASP, Atlanta, GA, may 1996.
Author Contact Information
Jinglun Gao, University of Delaware, 310 Evans Hall, Office Phone: 302-607-1808
EMAIL: gao@udel.edu
Word Version PDF Version